Models and Simulations | Ion Channels | Cardiac Cells | Cardiac Tissue
INa – fast sodium current
INa,b – background sodium current
ICa(L) – L-type calcium current
INaCa – sodium-calcium exchage current
Ip(Ca) – calcium pump current
ICa(T) – T-type calcium current
ICa,b – background calcium current
IKr – rapid delayed rectifier potassium current
IKs – slow delayed rectifier potassium current
IK1 – time-independant potassium current
IKp – plateau potassium current (ultra-rapid, I Kur )
Ito – transient outward current
INaK – sodium-potassium pump current
IK(Na) – sodium activated potassium current
IK(ATP) – ATP activated potassium current
Ins(Ca) – non-specific calcium activated current
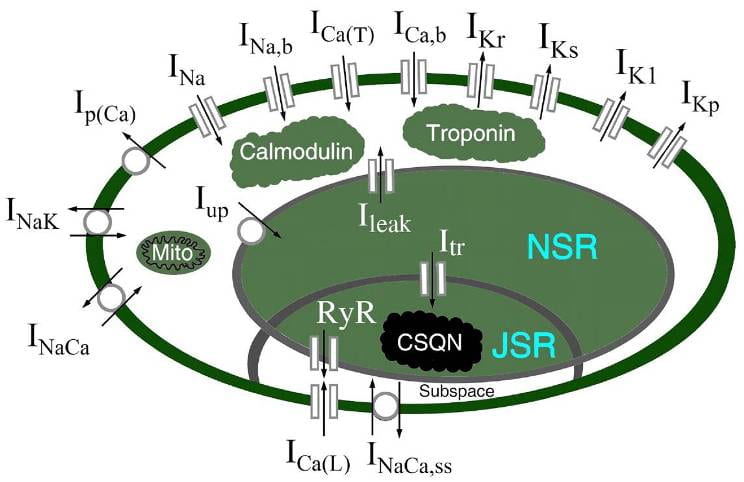
NSR – network sarcolplasmic reticulum
JSR – junctional sarcoplasmic reticulum
Iup – calcium uptake from myoplasm to NSR
Itr – calcium transfer from NSR to JSR
Ileak – calcium leak from NSR to myoplasm
Irel – calcium release from JSR to myoplasm
Troponin, Calmodulin, Calseqeustrin – calcium buffers
Figure 1. The action potential (AP), calcium transient (CaT) and select currents are shown for the most recent version of the LRd model published in 2000 by Faber and Rudy. IKr and IKs are the rapid and slow components of the delayed rectifier potassium currents respectively involved in membrane repolarization. ICa(L) is the L-type current carried by Ca2+ which participates in triggering calcium release from the sarcoplasmic reticulum, included in computation of gain. The gain measurement here is the ratio of the time integral of the flux through the ryanodine receptor channel (RyR) and the L-type channel. Results show steady state behavior at a pacing cycle length of 400 ms. We typically define steady-state when state variables vary by less than 1% with additional pacing.
Figure 2. Simulated LRd ICa(L) subject to the 40 mV AP-clamp waveform from Linz and Meyer 1998. ICa(L) has an amplitude that is less than 3 uA/uF during the entire plateau. Compare with Fig. 3 from Linz and Meyer.
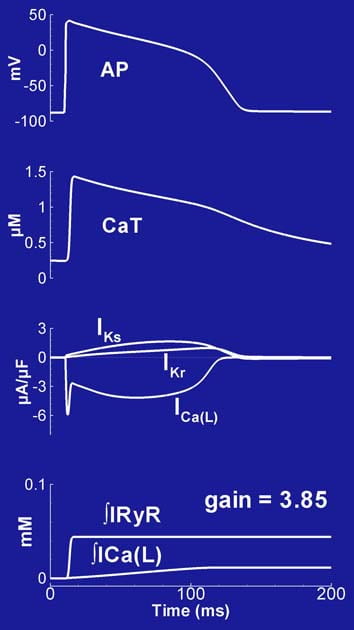 Figure 1 (Click to Enlarge)
 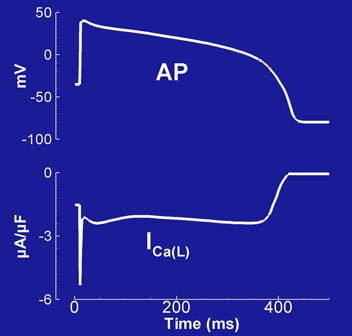 Figure 2 (Click to Enlarge)
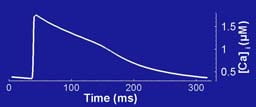
CaT from Choi and Salama 2000 (their Fig. 3) and simulated by the LRd model. In both experiment and LRd simulation, CaT decays slowly, extending beyond the AP.
LRD Model
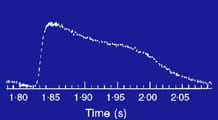
Experiment
Figure 3. Major ionic currents during the AP. Shown are the AP (repeated at the top of both columns for reference), the CaT, and selected ionic currents that determine the AP morphology. INa is shown on an expanded time scale (inset). The LRd model has reached a steady-state (beat to beat changes in all measures are less than 1%) during pacing at a constant basic cycle length (BCL) of 1,000 ms.
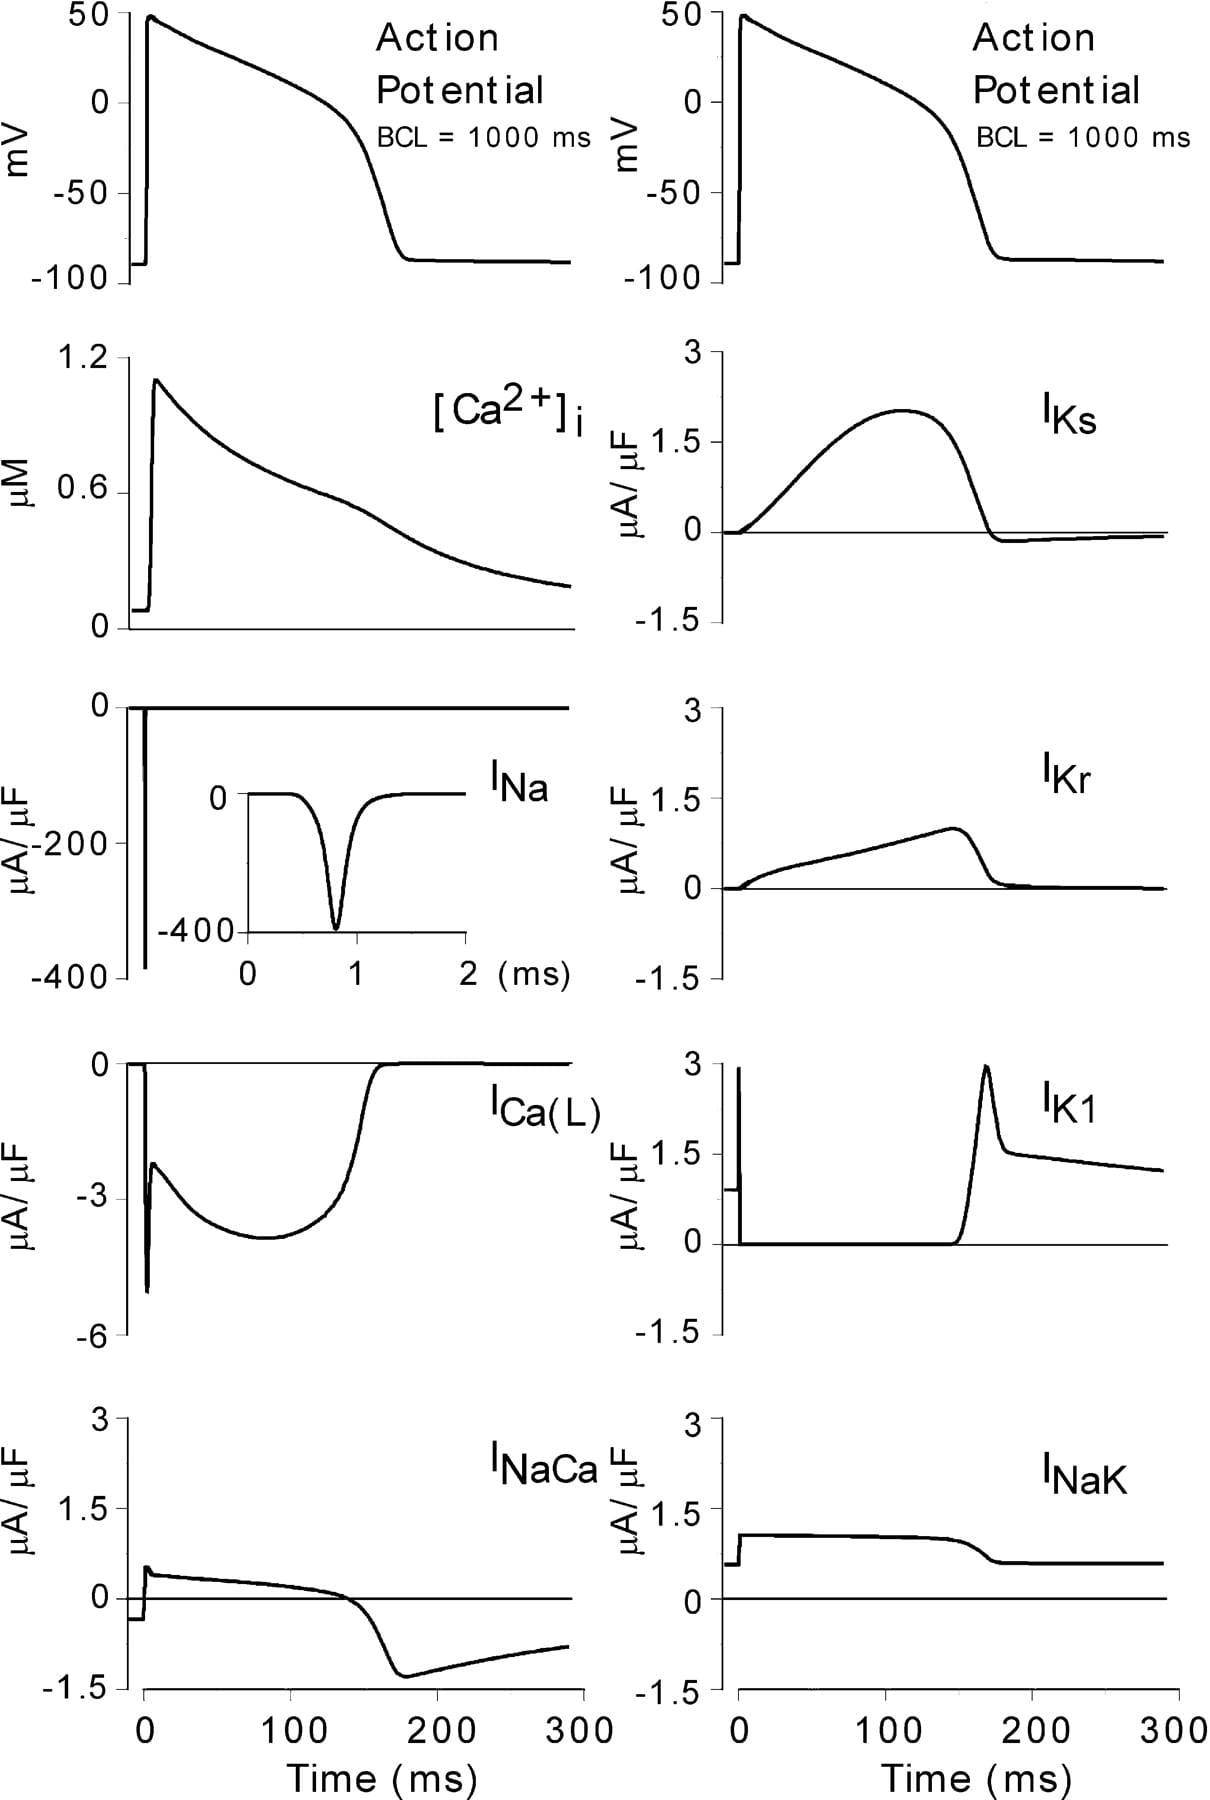 Figure 3 (Click to Enlarge)
The LRd simulated action potential and calcium transient are shown above, and measurements by Beuckelman and Wier are shown below. The simulation was performed at 37 degrees Celsius and the experiments were at room temperature. Time scales are adjusted so that results at the different temperatures correspond. Notice that not only morphology, but also magnitudes are accurately reproduced in the simulation.
 Measurements
(Click to Enlarge)
Measurements
(Click to Enlarge)