Theory
The Cardiac Electrical Source
During the cardiac excitation process, current sources arise in cell membranes throughout the heart. These sources can be characterized by a vector function J, an impressed current density that depends on time and space. J is nonzero only in cellular membranes, where it can be identified with ionic currents that are carried mainly by sodium, calcium, and potassium ions. While this constitutes a rigorous formal description of the cardiac sources, it is desirable to formulate alternative descriptions that lend themselves to quantitative evaluation, provide a basis for quantitative simulations of electric fields generated by the heart, and help relate the electrocardiographic potentials to the underlying cardiac activity.
Source Associated with a Single Cardiac Cell
The single cardiac cell is the elementary unit of excitation; therefore it is logical to begin characterization of the cardiac electrical sources by first formulating the elementary source associated with a single cell. The cellular action potential and its underlying membrane processes are addressed in the “Basic Mechanisms of Cardiac Excitation and Arrhythmias” section of the website. This page focuses on the cell as an electrical source of extracellular potential, rather than on membrane mechanisms of excitation.
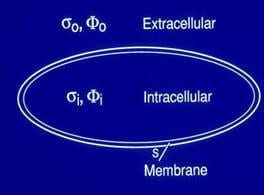
The action potential is the transmembrane potential during excitation. Two boundary conditions hold across the membrane surface: (1) The potential is discontinuous across the cell membrane and (2) its normal derivative is continuous. This behavior identifies the cell surface as the location of a double layer. In this form, the electrical cardiac source is no longer identified with ionic currents within the membrane. Rather, the double layer serves as an equivalent source that can be used to obtain the potential field in the extracellular domain. The extracellular potential is calculated by performing integration over the entire cell surface.
Source Associated with Normal Ventricular Activation
The fibrous architecture of the heart is such that the cardiac fibers are parallel to the endocardial and epicardial surfaces. In the normal heart, the purkinje system together with this anisotropic architecture lead to the formation of an activation front that is generally uniform and parallel to the endocardial surface. This activation front propagates from endocardium to epicardium. By superposition, the individual cellular double layers in this region of activation can be combined and replaced by an average dipole moment per unit volume. Because the extent of the rising phase is small compared with the ventricular wall thickness, it can be regarded as a two-dimensional surface of activation that constitutes a double layer.
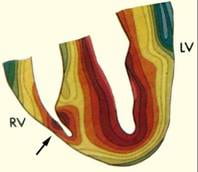
Activation fronts (Isochrones) during normal excitation of the human heart. Durrer et al., Total excitation of the isolated human heart. Circ.1970 Jun;41(6):899-912.
A diagrammatic illustration of a double layer activation front during normal right ventricular (RV) excitation is provided in the left panel of the figure below. The double layer strength is assumed uniform on the entire front, and its dipole components are perpendicular to the activation front, pointing toward the resting tissue. This uniform double layer model is an adequate representation of the sources during normal activation.
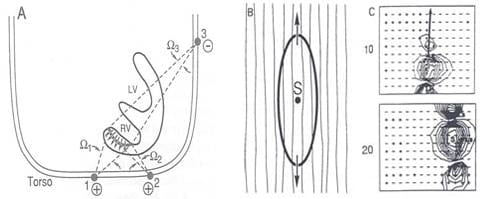
The situation is entirely different when one considers the activation front produced by point stimulation (e.g, activation from an ectopic focus). For this condition, the wave front is nearly ellipsoidal, with its major axis along the fiber direction and its minor axes perpendicular to the fiber direction (see the middle panel above). An equivalent source representation that incorporates myocardial anisotropy is the oblique dipole layer model, which contains axial and transverse component dipole densities.
THE ROLE OF THE TORSO VOLUME CONDUCTOR
The electrical activity of cardiac muscle cells is projected to the surface of the torso by means of the intervening conducting medium. The surface potentials that are recorded as electrocardiograms reflect not only the properties of the heart electrical generators, but also the surrounding passive volume conductor. Therefore, understanding the role played by the torso volume conductor in determining the surface potential distribution is important.
ELECTRICAL PROPERTIES OF THE TORSO VOLUME CONDUCTOR
The highest frequency of significance in bioelectric systems is approximately 1kHz. Also, magnetic materials are nearly absent in the thoracic region, so that the permeability equals 4*10-7H/m. The conductivities of the blood, lung, fat and muscles components of the body range from 0.0004 to 0.006 mho/cm, and a representative dimension of the body is 1m.
Given these parameters, the following simplifications can be made in analyzing the potential fields: (1) capacitive effects of the medium are negligible, and the medium is essentially resistive; (2) inductive effects are also negligible;(3)boundary conditions can be reduced to those of static electric fields; (4)propagation effects are negligible. Therefore, the field can be treated as quasi-static, implying that the potential distribution at any instant can be described by the electrostatic field equations.
EFFECTS OF THE TORSO VOLUME CONDUCTOR INHOMOGENOEITIES
To study the role of internal geometry and inhomogeneities, a mathematical model was constructed which permitted manipulation of these variables. The model, which consists of two eccentric systems of concentric spheres, contains all the important torso compartments. The model is shown in the left panel of the figure below. The inhomogeneities included in the model are the intracavitary blood masses, myocardium, pericardium, lungs, skeletal muscle, and fat. The spheres model simulations identified the following major effects of the inhomogeneities: (1) augmentation of body surface potential amplitudes due to the lungs, blood cavity and fat (see the right panel in the figure below), (2) reduction of amplitudes due to the higher conductivity skeletal muscle, (3) smoothing of body surface potentials, and (4) negligible effect on patterns (number and locations of maxima and minima, shape of the zero potential line, etc.). The studies also found the interface between the lungs and skeletal muscle as a major contributor to these effects.